Leading Indian FMCG company × Experidium · Hair & personal care · Edible oils · Foods
How Experidium connected a leading Indian FMCG company's three-tier distribution network to identify, quantify and test inventory decisions before stock moves.
The scale behind the problem
The company's India distribution network operates at a scale where a small inventory mismatch can propagate across multiple layers of the network.
Its published disclosures describe a distribution network of more than 7,500 distributors covering over 5.8 million retail outlets, supported by 24 depots and 6 redistribution centres. The network reaches more than 60,000 villages and almost every Indian town with a population above 5,000.
And the network continues to evolve. The company has outlined a three-year roadmap to increase direct reach from approximately 1 million to 1.5 million outlets, while using technology, analytics and supply-chain efficiencies to support the expansion.
At this scale, inventory planning isn't simply about knowing how much stock exists. It's about knowing:
Where is the stock?
Where should it be?
What is causing the mismatch?
And what happens if we change the decision?
The challenge
A stockout does not always mean "send more stock."
Consider a simple three-tier network:
- DepotCan be holding excess stock even when downstream demand is healthy.
- DistributorCan be holding excess inventory of exactly the SKU its retailer is short on.
- RetailerCan be below target — or seeing demand accelerate faster than the norm planners use.
Three situations. Three different decisions. A traditional stock report can show all three as an exception.
It doesn't necessarily tell the planner what to do next.
One network. Three tiers. Five data sources.
Experidium created a connected view of the distribution network across:
- 01 — DepotUpstream inventory and replenishment position
- 02 — DistributorIntermediate inventory, demand aggregation and downstream coverage
- 03 — RetailerActual market demand and shelf-level inventory position
The intelligence layer combines 5 operational data sources:
| Data source | What it contributes |
|---|---|
| Network master | Who supplies whom |
| SKU master | Product, cost and price |
| Inventory | On-hand stock and target norms |
| Demand | Weekly consumption |
| Orders | Replenishment moving through the network |
Retail demand rolls upward through the network:
- Retailer demandIts own weekly consumption
- Distributor requirementSum of its retailers
- Depot requirementSum of the retailers under it
This allows planners to see the inventory position as a connected system rather than isolated locations.
3 inventory problems. 3 different actions.
Experidium classifies inventory exceptions into three primary patterns.
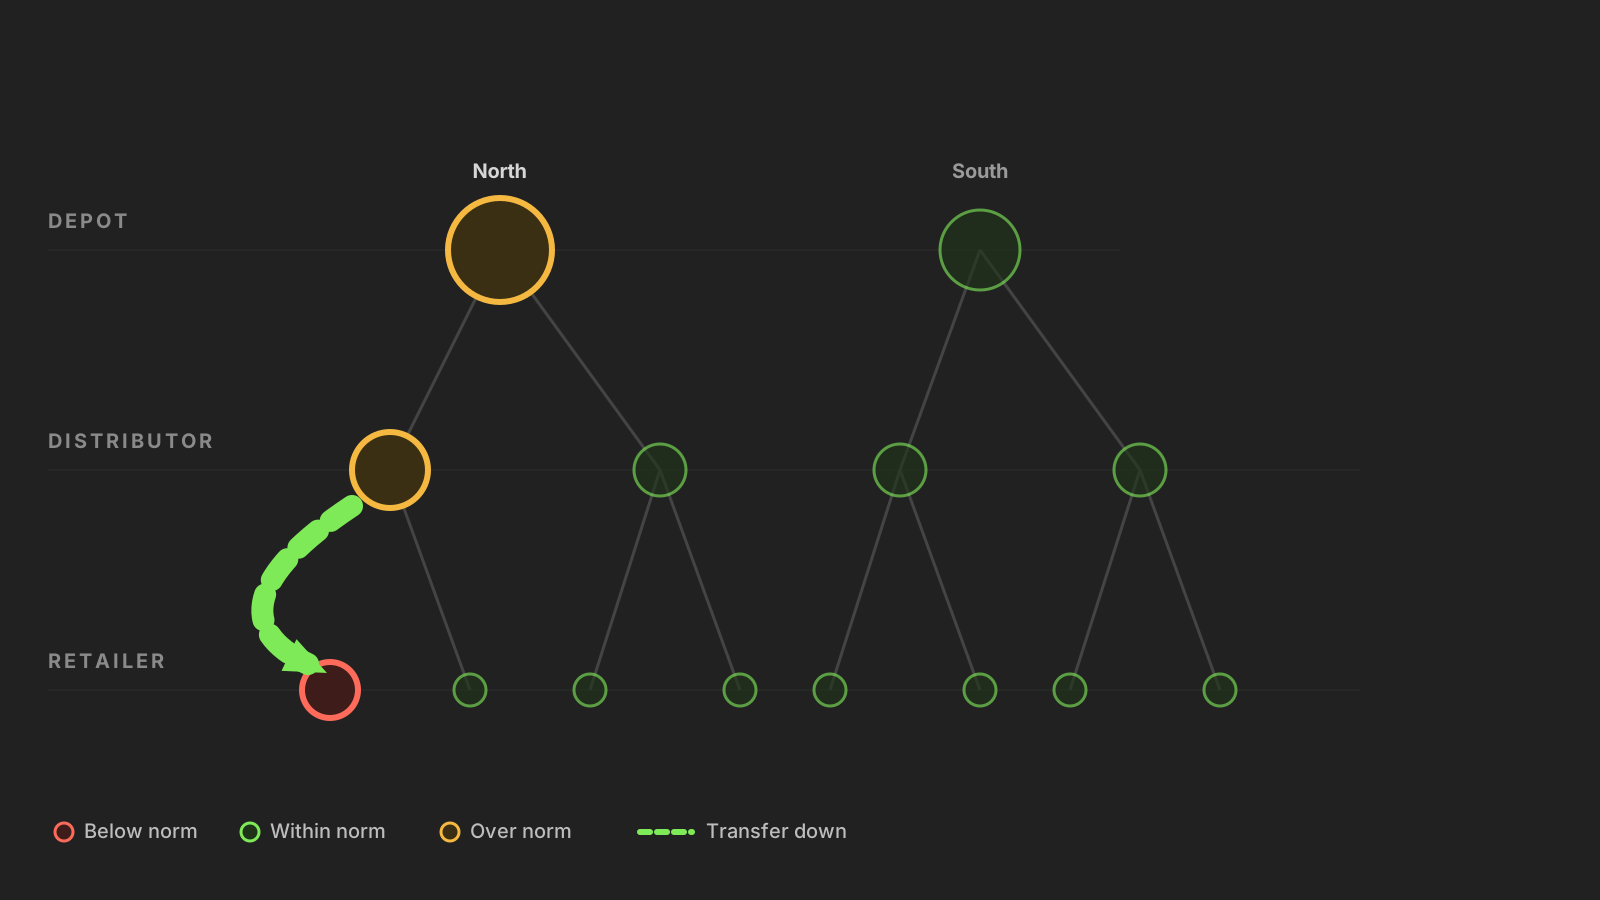
01 — Positioning
The inventory exists. It's just in the wrong place.
Retailer: below norm
Distributor: above norm
SKU: same
Instead of creating a new depot requirement, the system identifies the overlap between the distributor's excess and the retailer's shortage.
ActionMove existing inventory downstream.
02 — Trapped inventory
The inventory is sitting too far upstream.
A depot or distributor is materially above its target without a corresponding downstream requirement.
In the modeled North-chain scenario, the depot was approximately 2.2× its target level for the flagship edible oil — separate from the retailer-level positioning problem.
ActionReduce the upstream norm and move excess toward the market.
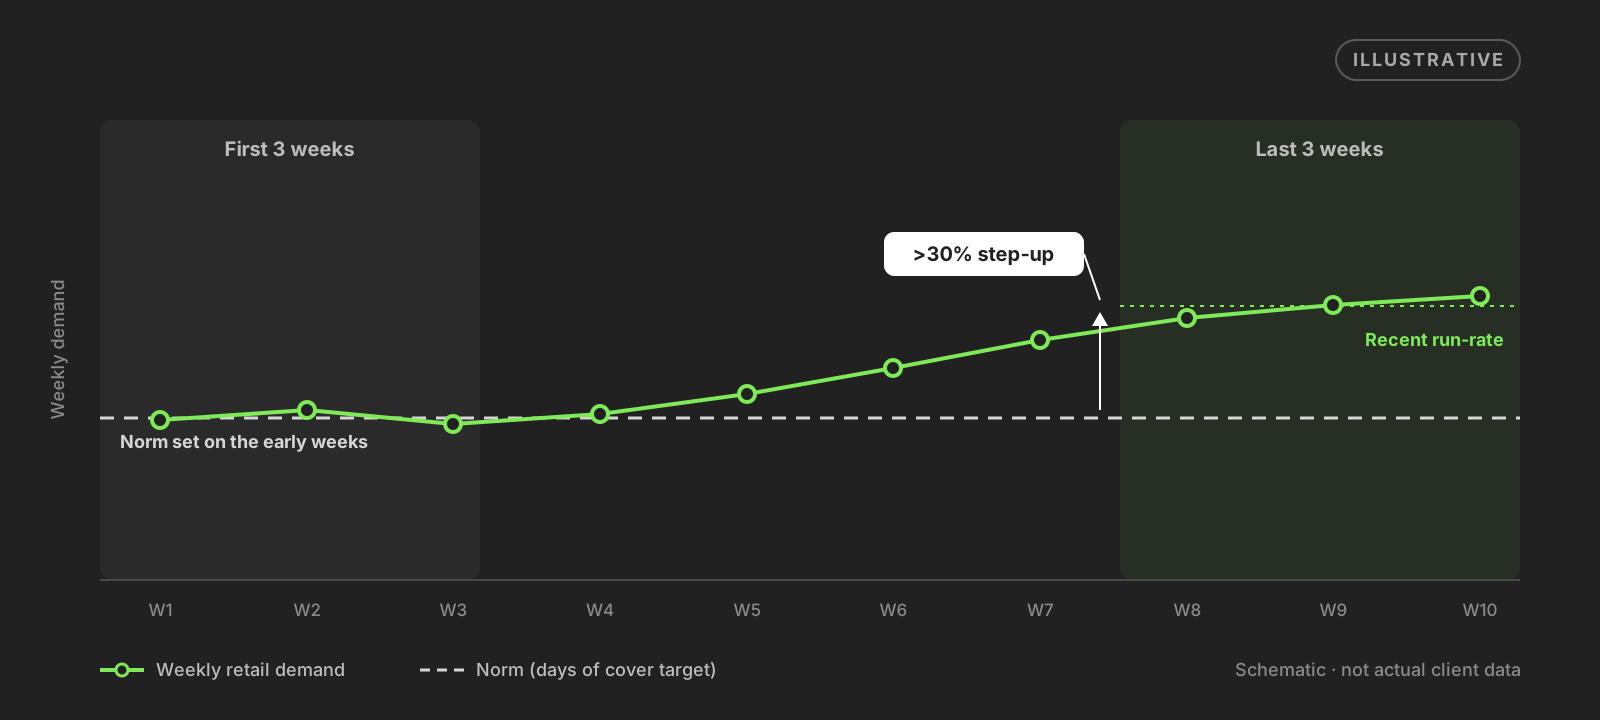
03 — Norm lag
Demand has changed. The target hasn't.
The system evaluates a 10-week demand window and compares the recent run rate with the earlier demand pattern.
When recent demand is more than 30% higher than the earlier period while inventory cover remains below the required target, the issue is classified as norm lag.
ActionRaise the norm and initiate a catch-up.
From red cells to rupees
Not every inventory exception deserves equal attention. Experidium ranks the imbalance by inventory value, rather than simply displaying another red/amber/green dashboard.
The calculation
Inventory imbalance = excess / shortage units × unit cost = ₹ impact
Every exception carries its evidence:
- On-hand quantity
- Target inventory
- Days of cover
- Demand trend
- Unit cost
- Rupee impact
- Recommended action
This turns
"This node is overstocked."
Into
"This node is holding ₹X of excess inventory, driven by Y units above target, and the recommended action is to reposition or reduce the upstream norm."
The exact financial value is calculated from the underlying inventory and SKU data rather than using a generic percentage estimate.
The operating model
The inventory bands
The modeled network uses tier-specific cover targets.
Inventory health is then evaluated against the relevant tier target:
On-hand stock as a share of the tier target
This gives the planner a common language for identifying where inventory is under pressure and where excess is accumulating.
A week inside the North network
The modeled scenario follows:
- 2 depotsNorth and South
- 4 distributorsTwo under each depot
- Multiple retailersUnder each distributor
across a core basket including:
- Coconut oil
- Edible oil
- Oats
- Hair care
- Control SKU
Three exceptions emerge:
- A retailer is short on coconut oil while its distributor holds excess.Decision: reposition.
- The North depot is holding the flagship edible oil at approximately 2.2× norm.Decision: reduce upstream exposure and move excess.
- Oats demand has accelerated across the recent 10-week window, but the target remains based on the older run rate.Decision: raise the norm and catch up.
The planner doesn't need to rebuild the analysis in another spreadsheet.
The network is already connected.
The exception is already ranked.
The action is already visible.
What if the situation changes?
Inventory decisions rarely happen under static conditions. That's why Experidium puts 6 scenario levers on the same screen.
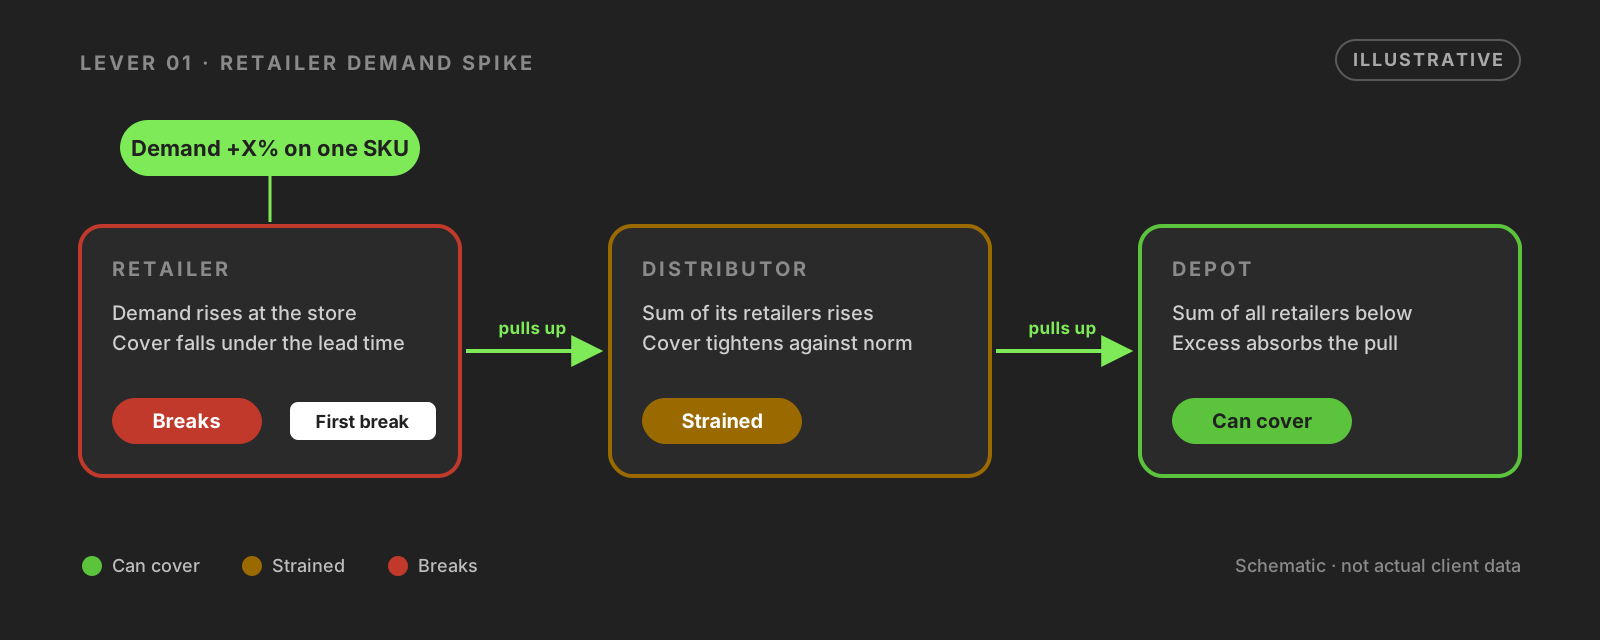
01
Retailer demand spike
Increase demand for a single SKU at a retailer and propagate the impact through distributor and depot.
02
Regional surge
Apply a demand increase across a region and see the combined network requirement.
03
Norm reset
Change the target days of cover at a node and recalculate the required inventory position.
04
Stock correction
Override recorded inventory when a physical count differs from the system.
05
Lead-time check
Introduce replenishment lead time and identify where available cover is insufficient.
06
Missed dispatch
Delay replenishment and simulate inventory depletion across the affected network.
The numbers change before the stock does
A planner can test:
- Demand +10%
- Demand +20%
- Norm −3 days
- Norm +5 days
- Dispatch +2 days
- Stock −X units
and immediately see how the change propagates through the network. The system identifies:
- Which node breaks first?
- Which SKU is affected?
- How many days until stockout?
- Where does the imbalance move?
- What intervention resolves it?
This is the difference between a dashboard and a decision layer.
From exception to action
The workflow becomes five steps:
- FindIdentify the node or SKU that is out of range.
- ExplainDetermine whether the problem is positioning, trapped inventory or norm lag.
- QuantifyMeasure the imbalance in units and rupees.
- SimulateTest the impact of a demand change, norm change, stock correction, lead-time issue or dispatch delay.
- ActReposition inventory, change the norm or initiate replenishment.
What changed?
Traditional inventory monitoring asks
"Where are we over or understocked?"
Experidium adds the questions that matter to the decision
- Is the inventory in the right place?
- Can existing excess solve another node's shortage?
- How much inventory value is trapped upstream?
- Has demand changed enough to invalidate the current norm?
- What happens if demand increases by 20%?
- What happens if the next dispatch is delayed?
- Which node breaks first?
The bigger picture
The company's distribution network is already one of its core competitive advantages, with 5.8 million outlets reached and an ongoing push to expand direct reach from approximately 1 million to 1.5 million outlets.
At this scale, better inventory decisions are not about optimizing one warehouse or one SKU. They are about understanding the relationships between thousands of inventory positions across the network.
Experidium's role is to turn those relationships into a decision layer:
- See the network.
- Find the imbalance.
- Quantify the exposure.
- Test the intervention.
- Move with confidence.
5.8M+ outlets. 3 tiers. 1 connected inventory view.
Ready to put your supply chain on autopilot?
Book a discovery call. We'll talk through your biggest supply chain pain points and where AI agents could help.